What's in The Fouling Deposit?

In the last blog “How Heat Exchangers Foul in Different Fluid Phases”, we touched on how specific precursors could lead to fouling in oil & gas heat exchangers. Additionally, we discussed how different flow and temperature conditions impact the rate of deposition, as well as the transformation of precursors into the final fouling deposit. To figure out the applicable fouling mechanism and identify possible countermeasures, it is essential to understand the deposit composition- whether it's primarily formed of inorganic or organic matter, and the quantity of the elements and compounds in the deposit. In this article, we'll delve into how to accurately measure the composition of a fouling deposit.
The procedure covered in this article involves preparing the sample for testing and executing the tests in a specific order to gather all necessary information, without over-testing. It is worth noting that simply knowing which chemical elements or compounds are found in the deposit does not provides sufficient information. It’s essential to quantify each element to find out if any of them are predominant; or if different types of solids exist in significant quantities.
Step 1 - Sample Preparation
The most crucial step to obtain an exact analysis of the fouling deposit lies in the correct preparation of the sample. Sample preparation involves two aspects: the removal of trapped fluid and the transformation of the solids into a homogenous mixture. The specific procedures explained below are relevant to deposits resulting from petroleum oil and petrochemicals processing heat exchangers (or other similar equipment). However, the concepts can be applied to other process heat exchangers by using the appropriate solvents and test methods. All subsequent analyses should be conducted on the sample prepared following the procedure below.
Process fluid removal – Deposits usually contain the process fluid which can be trapped within the deposit or coating the samples. The deposit might also contain cleaning solutions, steam-out water, and so on. The trapped fluids or cleaning solutions are not part of the foulant and must be removed before analysing the deposit. Toluene, methylene chloride, or equivalent solvents should be employed to extract and rinse off such residual feeds and washing solutions. To identify the fouling root cause and potential mitigation techniques, we need to know what's in the solid component of the deposit, excluding the process fluid and other liquids from the analysis.
To remove the fluids, add one of the above-mentioned solvents to a sufficient quantity of the sample. Typically, 5-10 grams of the prepared sample are sufficient for the initial stage of the study. If the sample seems to contain significant levels of unwanted fluids, choose a larger quantity so that 5-10 grams of solvent-washed foulant can be recovered. Allow the deposit to soak at room temperature for several hours in a sealed container with around 10:1 amount of the solvent. Filter the mixture and rinse with additional solvent at least three times, or until the final filtrate is clear, indicating all trapped fluid has been removed. Discard the filtrate and dry the remaining deposit in a vacuum oven at 100°C overnight.
Homogenization – Fouling deposits do not have a uniform composition, so it's important to mix the sample thoroughly to obtain an average composition and avoid being misled by analysing a portion of the deposit that might be high in one component. Homogenize the dried material by first grinding and sieving the entire sample to at least -60 mesh particle size, then mixing well.
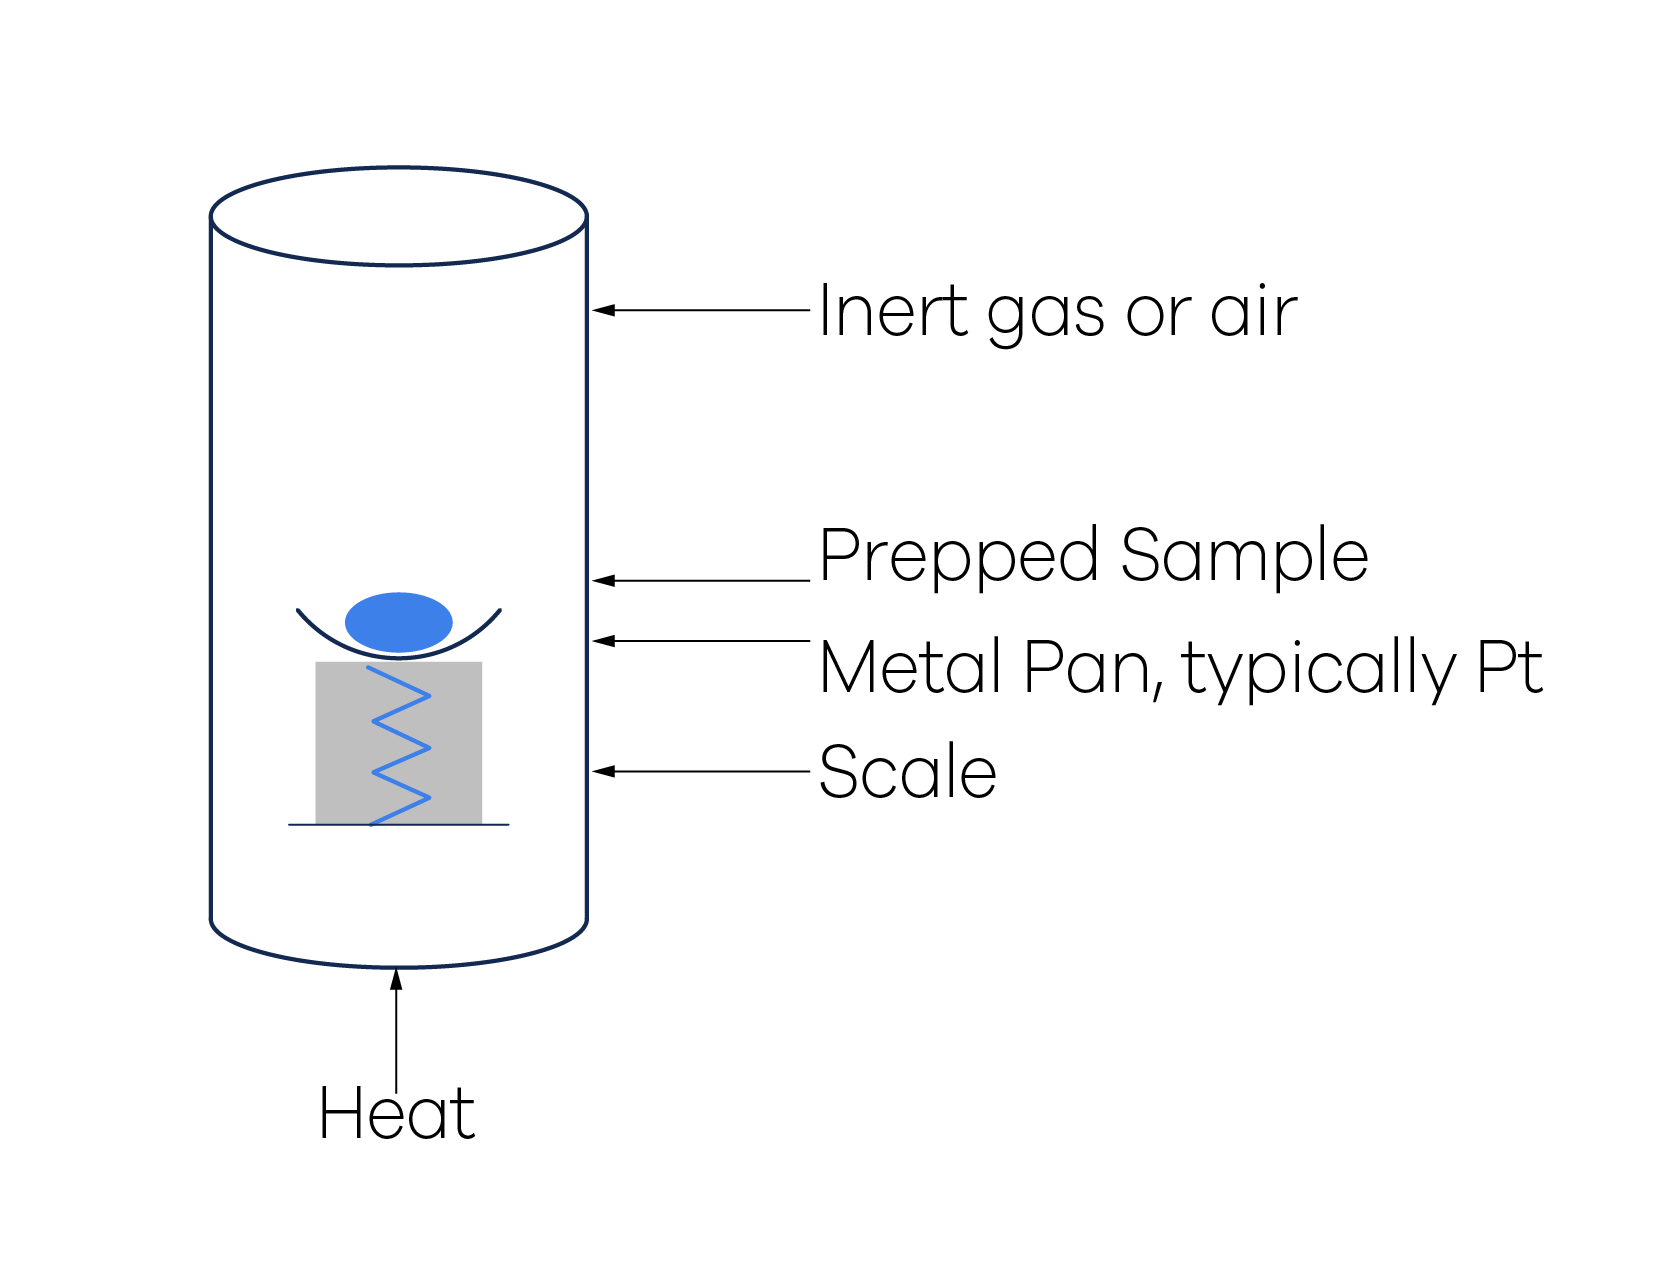
Step 2 – ThermoGravimetric Analysis (TGA)
TGA testing involves heating the sample under an inert atmosphere, progressively increasing the temperature from room conditions to 800 °C, while continuously weighing the sample to measure the weight loss. Once 800 °C is reached, air replaces the inert atmosphere so that the remaining sample can combust. The solid that remains after combustion is called ash. The TGA test is recommended because it’s rapid (~3 hours),cost effective, and provides a good amount of useful information.
The loss of material during heat-up to 800 °C is typically organic material that is still volatile. Introducing air at this point and observing the weight loss during combustion reflects the amount of coke or coke-like material, as explained in the article “How Heat Exchangers Foul in Different Fluid Phases”. Ash represents the inorganic portion of the deposit.
The TGA results provide a reliable quantification of the organic and inorganic components of the deposit, and how much of the organic portion is coke. This information is helpful in guiding further testing and preventing unneeded tests.
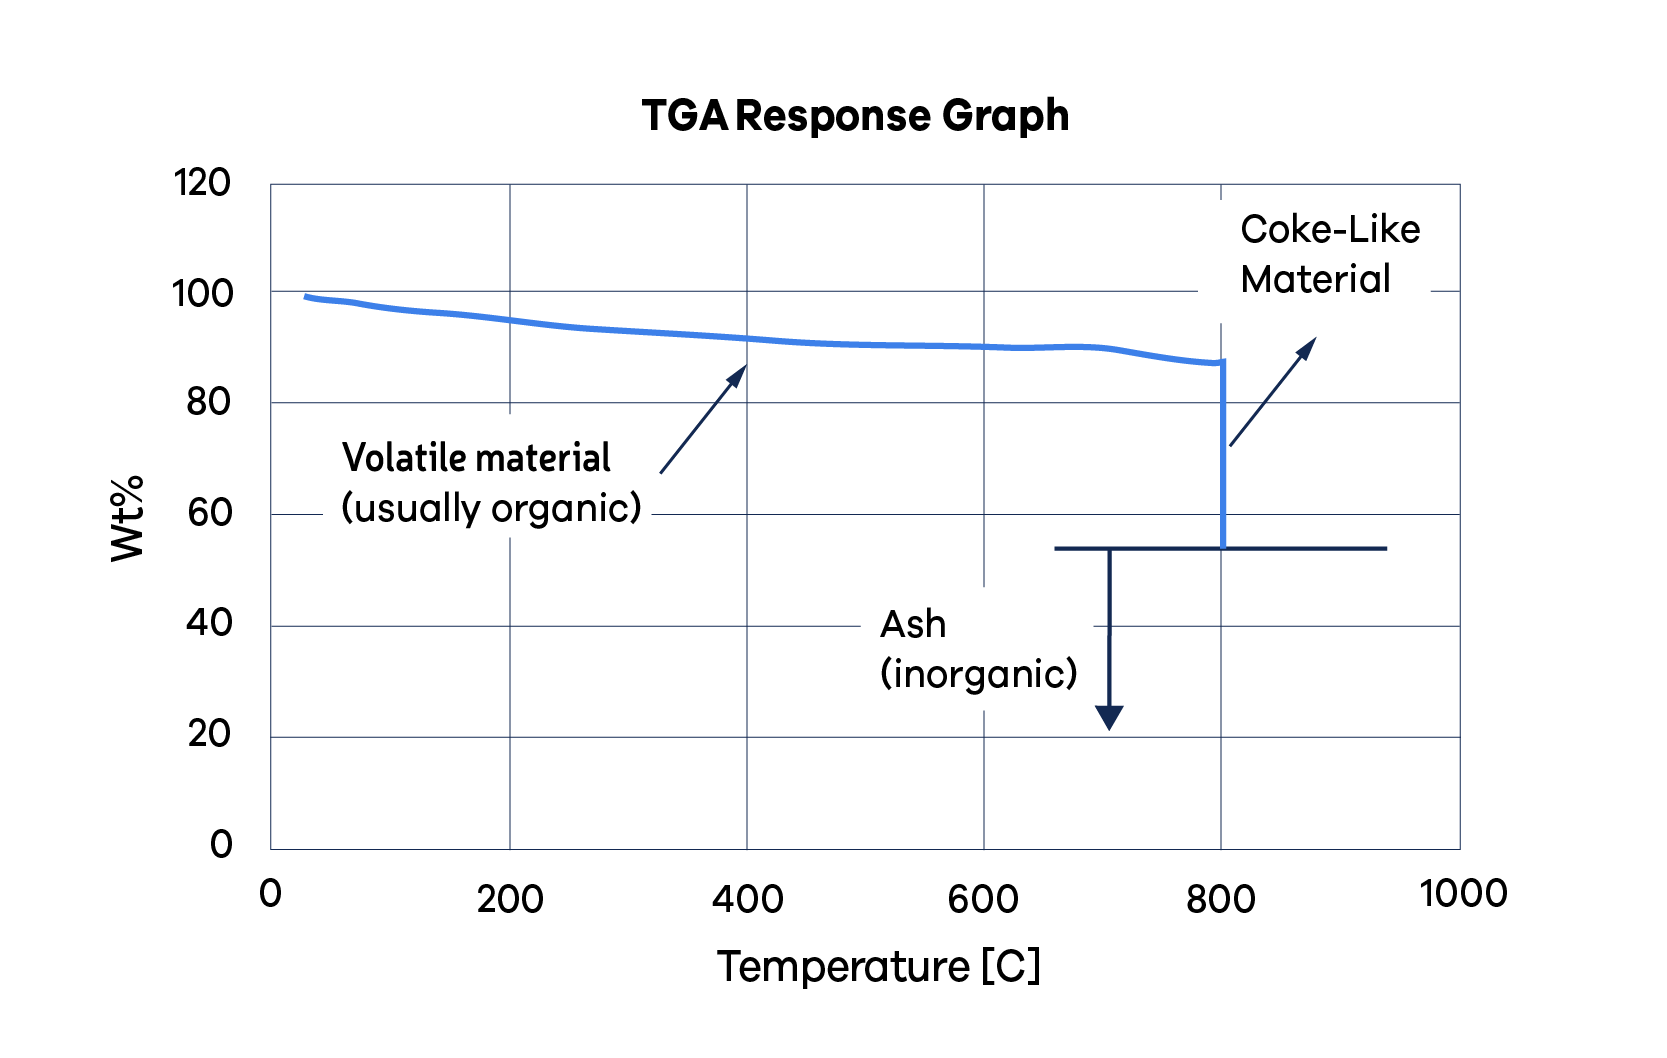
Figure 2 displays a graph for a TGA, illustrating weight against time. The vertical axis represents the initial weight percentage, gradually declining to the weight percentage of the ash. The graph can be interpreted in this way:
- Roughly 12% of the substance is comprised of volatile organics (with 88 wt% still intact at 800 °C),likely to be polymeric material combined with residual fluids from incomplete sample processing.
- About 33% of the material is either coke or coke-like (with 55% remaining post-combustion, [88-55] = 33), contributing to a total organic portion of 45%.
- Roughly 55% of the substance is ash, representing the inorganic component of the deposit.
Step 3 – Elemental Analysis
Elemental analysis involves three major tests:
1. Carbon, Hydrogen, Nitrogen(CHN);
2. Sulphur;
3. Metals and other inorganics.
TGA results guide the decision on which of these tests must be performed. For example, if TGA shows that the deposit is 90% ash (inorganic), then quantifying the carbon and hydrogen is not necessary. On the other hand, if the deposit is 90% organic ora mixture, all tests are necessary.
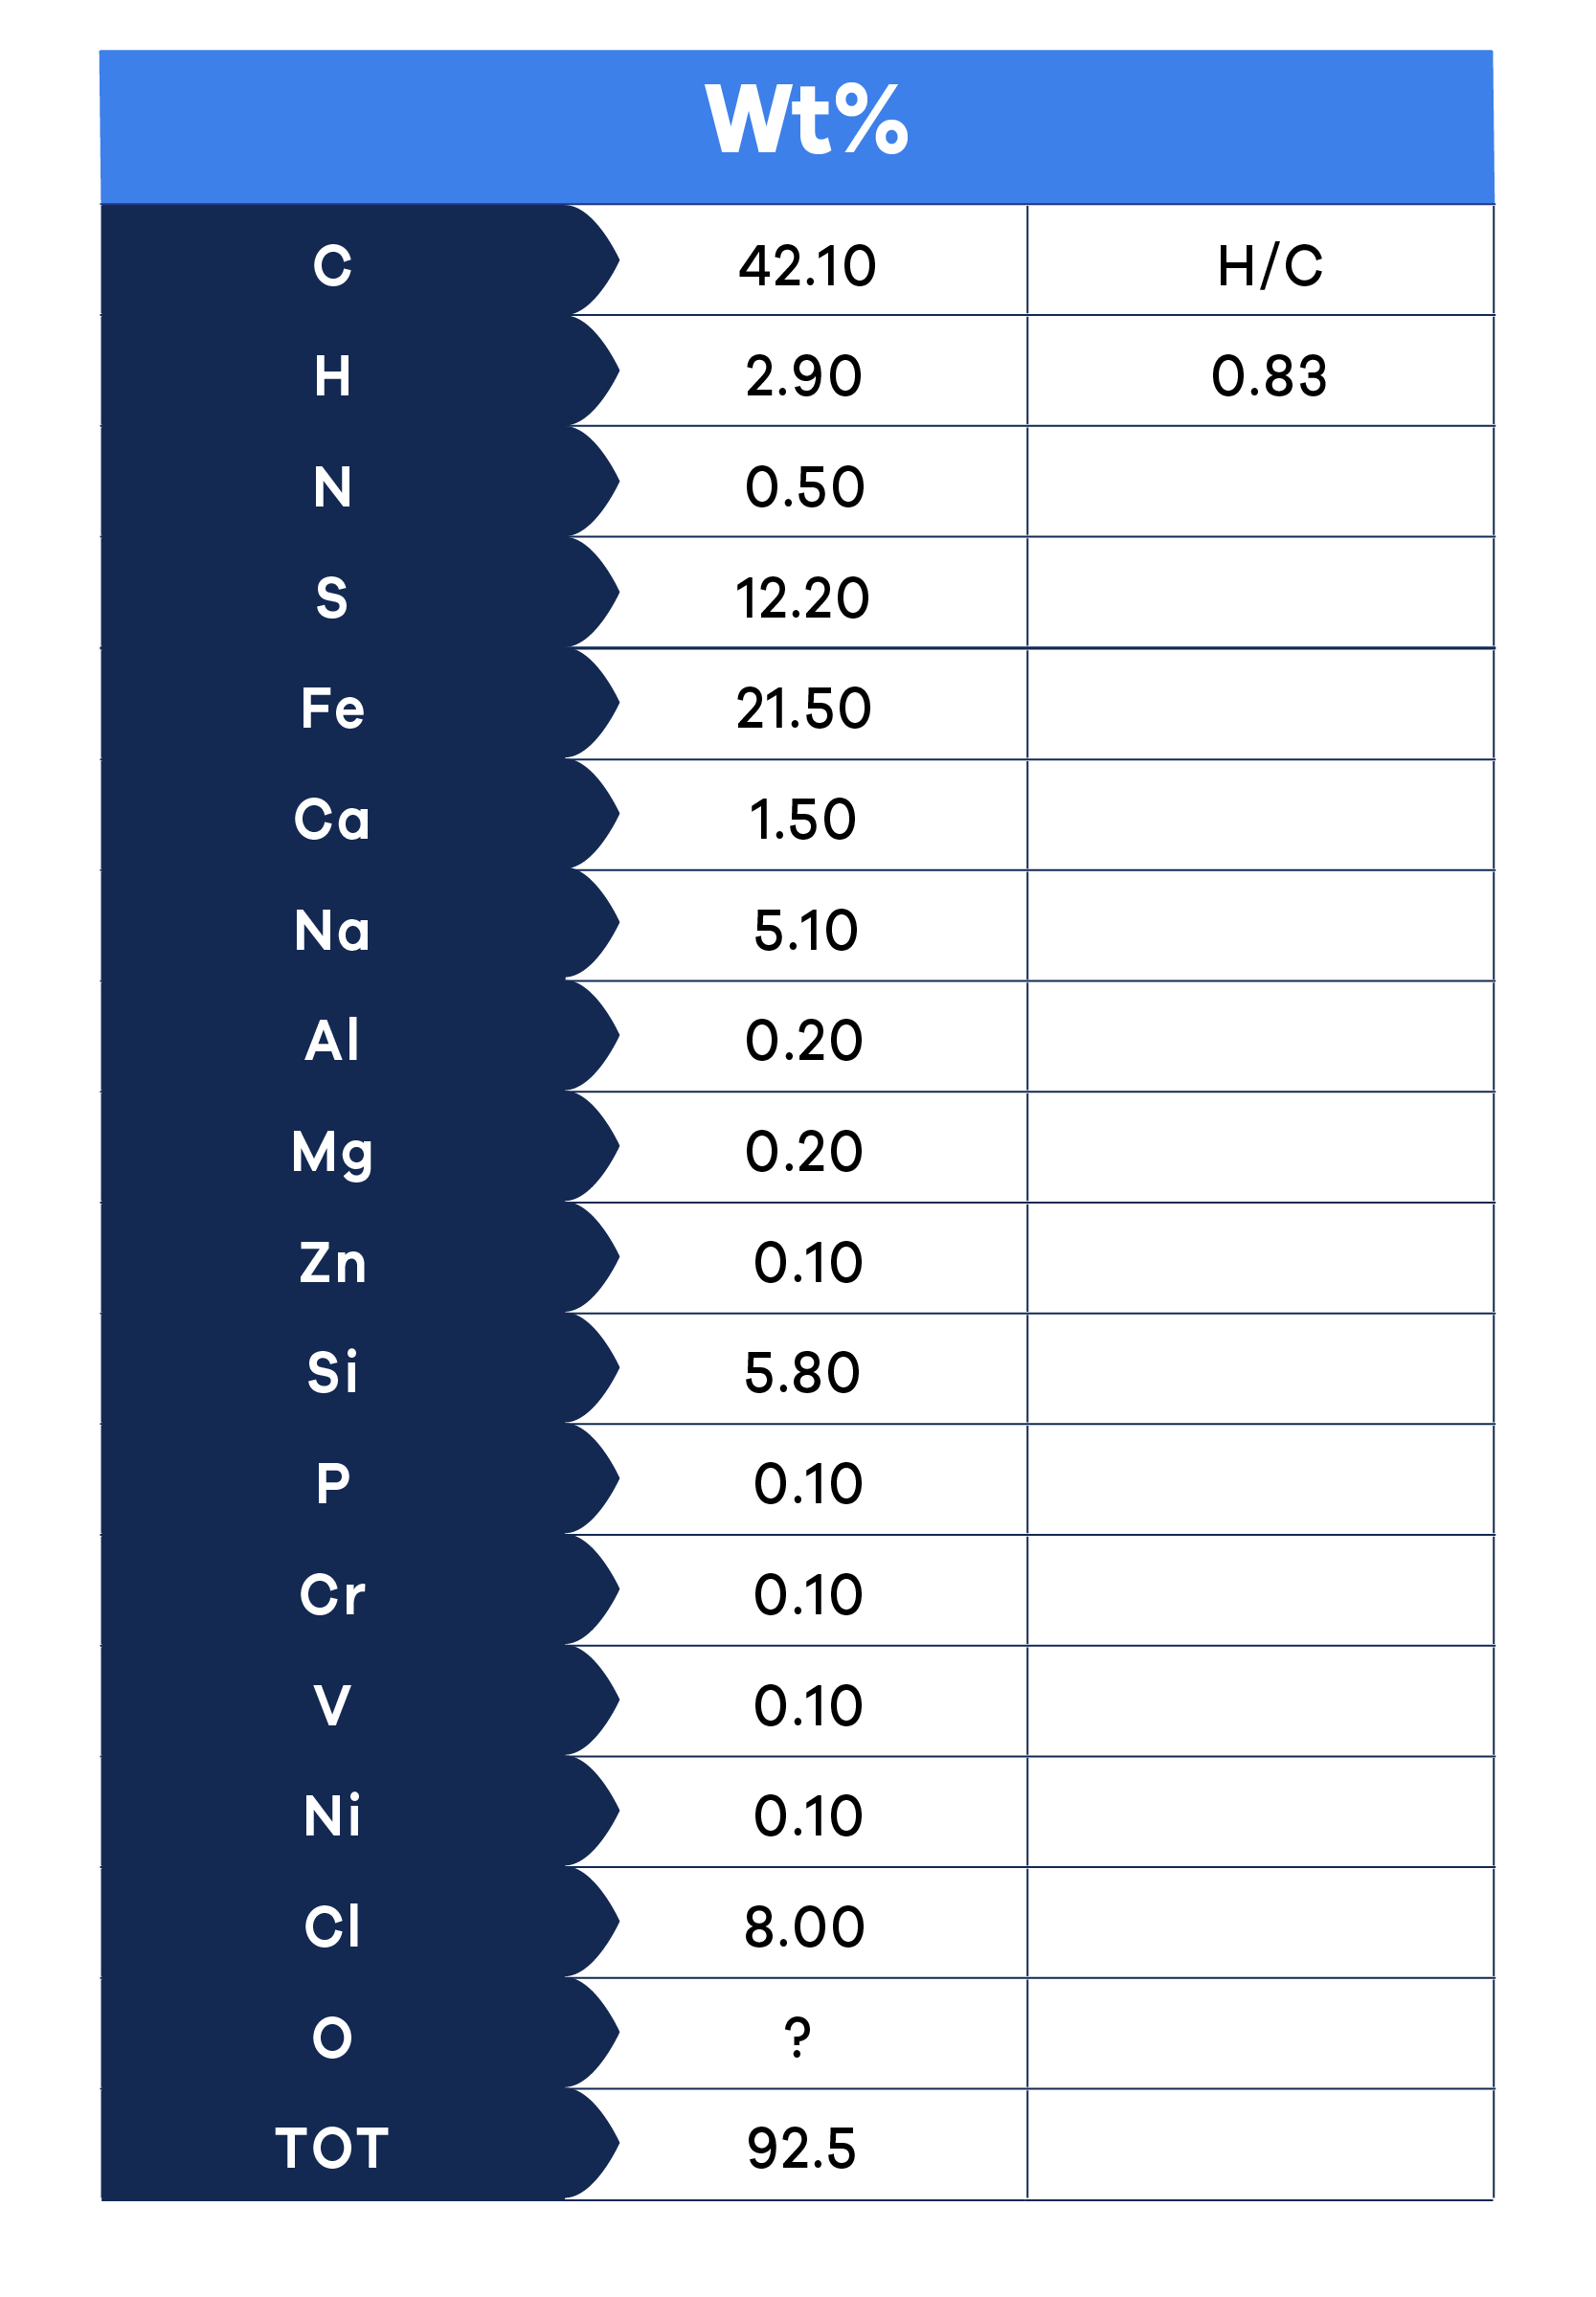
All the described tests are standardized (like the ASTM Standards) and are relatively inexpensive with around a week's turnaround time. Fig. 3 shows an example of analytical testing results and displays a composition of approximately 45% organic materials and inorganic substances primarily comprising salt (NaCl), corrosion products (FeS), and silica (SiO2).
Data in Fig. 3 highlight two significant aspects:
- Mass balance - Ideally, the weight percentage of all detected elements should total 100%. However, a result of 90% or more is considered adequate in real-world applications. Often, any shortfall may be ascribed to oxygen. In this instance, it's clear that silicon must be associated with oxygen, which is not measured.
- The H/C atomic ratio - This metric is useful to determine the temperature at which the coke-like substance in the deposit was created. We will further explore this in the next article.
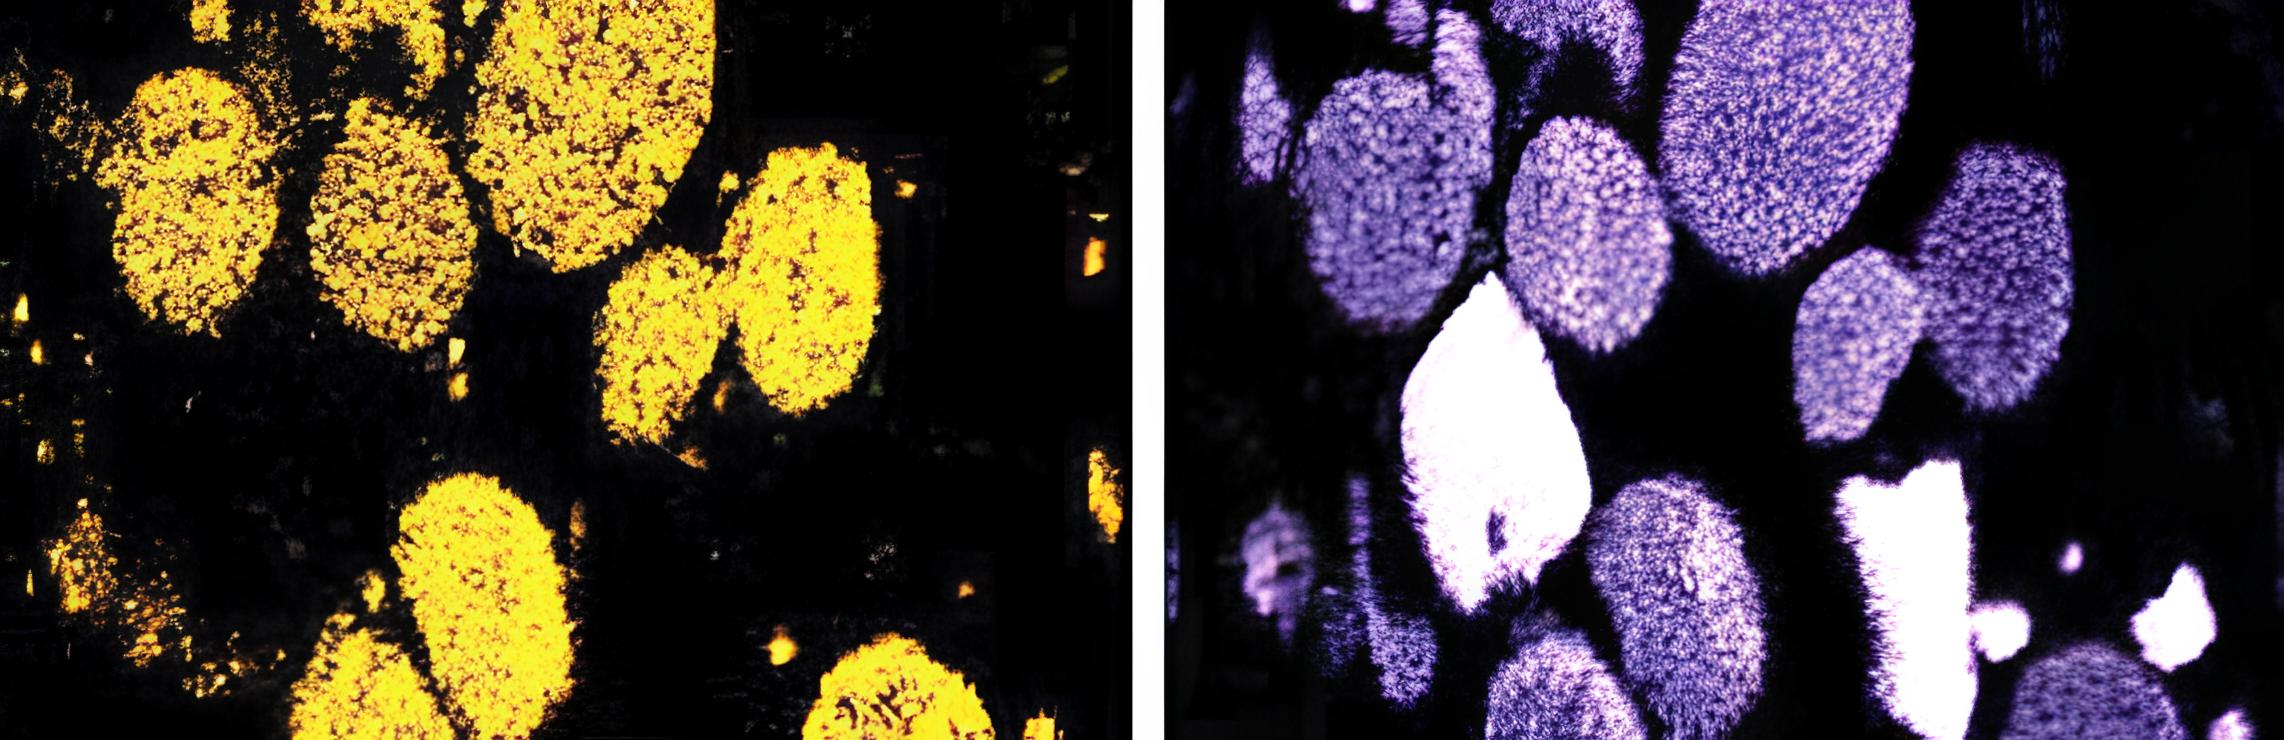
Microscopy
Microscopy is sometimes crucial to understand the mechanism and identify the precursors.Additionally, it helps to confirm the analytical results. There are two types of microscopies that can be used: SEM (Scanning Electron Microscopy) to identify the association of elements (Fig. 4) or see how layers form on a surface, and Cross-Polarized Light Optical microscopy to understand the nature of coke in the deposit. More details are in the Reference.
Second-Level Testing
In case the two testing steps above (including the microscopy) do not provide ample clarity, you need to identify specific substances, or the information is not sufficient to determine the entire composition, there are second-level tests that can be employed. Usually, these are necessary less than 10% of the time:
- Carbon in Carbonate Form. This is an effective method to distinguish between organic and inorganic carbon, and to attribute some of the unaccounted mass to oxygen.
- Sulfur Types. This tool allows you to discern between organic sulfur and inorganic forms like pyritic sulfur and sulfates.
- Neutron Activation Analysis. This is a methodology to achieve high-precision oxygen measurement.
- X-Ray Diffraction. This is an ideal test to determine specific crystalline materials or crystal compound phases, such as the form of iron sulfide.
Conclusion
Accurate measurement of a fouling deposit enables us to identify the predominant fouling process, trace the sources of precursors, and implement the most cost-effective fouling mitigation measures. For dependable results, we recommend utilizing the previously explained sample preparation stage, followed by two first-level tests – TGA and Elemental Analysis, which cover 90-95%+ of the deposits. In 5-10% of scenarios, additional testing may be necessary. Those interested in conducting this analysis can find supplementary information in the Reference.
In our forthcoming article, we will examine how to combine deposit analysis and operational conditions, inclusive of feed testing, to find the active fouling mechanisms.
You can find more details in the procedure in the Crude Oil Fouling book.
Reference
Joshi, H. M., in Crude Oil Fouling – Deposit Characterization, Measurements, and Modeling, Coletti, F., and Hewitt, G. F., Editors, pp 95-113, Elsevier Inc., 2015.